Data Science and Hadoop: Part 3, Basic Structural Analysis
Context
This is the third part of a 5 part series on analyzing data with PySpark:
- Data Science and Hadoop : Impressions
- Data Overview and Preprocessing
- Basic Structural Analysis
- Outlier Analysis
- Benford’s Law Analysis
Basic Structural Analysis
Now that we have the data prepped and loaded into HDFS, let’s perform some basic queries to get a sense of the data’s shape and size. This data is fundamentally relational (it’s a single table), so thankfully a query language was invented a while ago to assist us in this task. It works well, so we won’t write complex MapReduce or spark to recreate it.
Some Preliminaries
Let’s start with some preliminary imports and helper functions.
import random as random
import re
import locale
import itertools

import sympy
from sympy import *
import pandas
from pandas import DataFrame
import math
import scipy.stats as stats
import numpy as np
from sympy import latex

import matplotlib
from matplotlib import pyplot as plt

from pyspark.sql import SQLContext
from pyspark import Row

import seaborn as sns
from IPython.core.display import HTML

#initialize some things for the IPython session
init_printing()
locale.setlocale(locale.LC_ALL, 'en_US')

#Generate a bar chart with data, title, y-label, x-label and whether
#the chart should be bar scale.
def bar_chart(label_to_count, title, y_label, x_label,log):
    OX = [x[0] for x in label_to_count]
    OY = [y[1] for y in label_to_count]
    fig = plt.figure()
    fig.suptitle(title, size=14)
    ax = plt.subplot(111)
    width = .35
    ind = np.arange(len(OY))
    rects = ax.bar(ind, OY, alpha=0.35, color='b', label=y_label)
    for ii,rect in enumerate(rects):
        height = rect.get_height()
        plt.text(rect.get_x()+rect.get_width()/2., 1.02*height, '%.2fM'% (OY[ii]),
                ha='center', va='bottom')
    ax.legend()
    ax.grid(True)
    ax.set_xticks(np.arange(len(OX)) + width)
    ax.set_xticklabels(OX)
    ax.set_ylabel(y_label)

    fig.autofmt_xdate()

#Take a 2D array of data and create a dataframe to display
#the data in tabular form
def print_table(column_labels, row_labels, contents):
    tmp = [[t[0]] + t[1] for t in zip(row_labels, contents)]
    df = DataFrame(tmp, columns=column_labels)
    pandas.set_option('display.max_colwidth', 100)
    display(HTML(df.to_html()))

#Truncate long lines on word boundaries
def truncate(line, length=40):
    if(len(line) > length):

        output_line = ""
        for token in line.split(' '):
            next = output_line + " " + token
            if len(next ) >= length:
                return next + "..."
            else:
                if len(output_line) == 0:
                    output_line = token
                else:
                    output_line = next
    else:
        return line
Spark SQL
We’ll use Spark SQL to overlay a structure on the data. I have chosen to use Spark SQL, but I also could have hooked Hive up to do these queries. There are tradeoffs for both, Spark SQL turns into direct Spark operations, whereas Hive is calling out externally to Hive, so you aren’t building up a RDD lazily. However, Hive is more mature and supports more SQL. For our purposes we are using very simple queries, so we’ll stick to Spark SQL.
Note that the output of the Spark SQL call is a RDD, a resilient distributed dataset, which is a dataset which can be operated on by other parts of the spark ecosystem. So, you’ll see me mix fundamental Spark operations (e.g. map, join, groupByKey, filter, etc.) with SQL calls.
#Let's overlay some structure from our raw data

#after the pig job, we get a ctrl-A separated file
raw_data = sc.textFile("/user/hrt_qa/open_payments/general/post/part-m-*")

#create a SQL Context so that we may use spark-sql
#This allows us to use a very simple subset of SQL, for a more complete
#set of SQL available, you can use Hive as the underlying engine
#by using HiveContext instead of SQLContext
sqlContext = SQLContext(sc)

#split up the line into tokens separated on ctrl-a
parts = raw_data.map(lambda l : l.split('\x01'))

#We're only really concerned about a few fields, so we'll project out only
#the fields we're interested in.
def tokens_to_columns(tokens):
    return Row( physician_id=tokens[7]\
              , physician_name="{} {}".format(tokens[8], tokens[10])\
              , physician_specialty=tokens[21] \
              , payer=tokens[43] \
              , reason=tokens[52] \
              , amount_str=tokens[48] \
              , amount=float(tokens[48]) \
              )

#Consider rows with either empty or null physician ID's to be bad and we want
#to ignore those.
payments = parts.map(tokens_to_columns)\
                .filter(lambda row : len(row.physician_id) > 0)

#Now, we can register this as a table called payments.
#This allows us to refer to the table in our SQL statements
schemaPayments = sqlContext.inferSchema(payments)
schemaPayments.registerAsTable('payments')
From a much larger schema (defined in this zip bundle ), we are projecting out a small set of columns:
- Physician ID
- Physician Name (redacted)
- Physician Specialty
- Paying organization (aka payer)
- Reason for payment
- Amount of payment as float
Types and Money
Now, those of you with experience doing analysis are now cringing at my use of a float for money. Spark has support for a “decimal” type, which is backed by Java’s BigDecimal. Unfortunately, I had some trouble getting the decimal type to work in the python bindings. It complained:
java.lang.ClassCastException: java.math.BigDecimal cannot be cast to scala.math.BigDecimal
 scala.math.Numeric$BigDecimalIsFractional$.plus(Numeric.scala:182)
 org.apache.spark.sql.catalyst.expressions.Add$$anonfun$eval$2.apply(arithmetic.scala:58)
 org.apache.spark.sql.catalyst.expressions.Add$$anonfun$eval$2.apply(arithmetic.scala:58)
 org.apache.spark.sql.catalyst.expressions.Expression.n2(Expression.scala:114)
 org.apache.spark.sql.catalyst.expressions.Add.eval(arithmetic.scala:58)
 ...
(Note: this is with Spark 1.1.0)
Given this bug, I did not see a way to use Spark SQL to support a data type suitable for money operations, so I treat the amounts as floats. In production, I’d have probably investigated more what I was doing wrong or moved to the Hive interface for Spark SQL.
Top Payment Reasons by Number of Payments
First thing we’ll look at is a break-down of the payment reasons and how many payments are in each.
#Broken down by reasons
count_by_reasons = sqlContext.sql("""select reason, count(*) as num_payments
                                     from payments
                                     group by reason
                                     order by num_payments desc""").collect()

print_table(['Payment Reason', '# of Payments']\
               , [x[0] for x in count_by_reasons]\
               , [ [locale.format("%d", x[1], grouping=True)] \
                   for x in count_by_reasons]\
)| Payment Reason | # of Payments |
|---|---|
| Food and Beverage | 2,192,057 |
| Travel and Lodging | 135,235 |
| Education | 122,839 |
| Compensation for services other than consulting, including serving as faculty or as a speaker at... | 77,236 |
| Consulting Fee | 45,525 |
| Gift | 26,422 |
| Honoraria | 10,900 |
| Compensation for serving as faculty or as a speaker for a non-accredited and noncertified contin... | 4,377 |
| Royalty or License | 3,268 |
| Grant | 2,881 |
| Space rental or facility fees(teaching hospital only) | 2,114 |
| Current or prospective ownership or investment interest | 1,559 |
| Entertainment | 1,400 |
| Charitable Contribution | 480 |
| Compensation for serving as faculty or as a speaker for an accredited or certified continuing ed... | 381 |
Top 10 Physician Specialties by Number of Payments
I’m always intrigued to look at how specialties differ. Anyone who has worked with physicians as either managers, colleagues or as subject matter experts will notice that different specialties have different characters. I will leave that observation there and not endeavor to be more specific, but I wanted to see if anyone was getting paid extremely well in this dataset.
#Which specialties are getting the most reimbursements?
totals_by_specialty = sqlContext.sql("""select physician_specialty
                                             , count(*) as cnt
                                             , sum(amount) as total
                                        from payments
                                        group by physician_specialty""")\
                                .collect()
total_count_by_specialty = sum([t[1] for t in totals_by_specialty])
top_count_by_specialty = sorted(totals_by_specialty\
                               , key=lambda t : t[1], reverse=True)[0:10]
print_table(['Specialty', '# of Payments', "% of Payments"]\
           , [x[0] for x in top_count_by_specialty]\
           , [ [ locale.format("%d", x[1], grouping=True)\
               , '{0:.2f}%'.format(100*x[1]/total_count_by_specialty)\
               ] \
               for x in top_count_by_specialty]\
)| Specialty | # of Payments | % of Payments |
|---|---|---|
| Allopathic & Osteopathic Physicians/ Family Medicine | 430,771 | 16.00% |
| Allopathic & Osteopathic Physicians/ Internal Medicine | 417,155 | 15.00% |
| Allopathic & Osteopathic Physicians/ Internal Medicine/ Cardiovascular Disease | 160,342 | 6.00% |
| Allopathic & Osteopathic Physicians/ Psychiatry & Neurology/ Psychiatry | 121,067 | 4.00% |
| Allopathic & Osteopathic Physicians/ Internal Medicine/ Gastroenterology | 92,531 | 3.00% |
| Allopathic & Osteopathic Physicians/ Psychiatry & Neurology/ Neurology | 89,673 | 3.00% |
| Other Service Providers/ Specialist | 80,576 | 3.00% |
| Allopathic & Osteopathic Physicians/ Obstetrics & Gynecology | 65,434 | 2.00% |
| Allopathic & Osteopathic Physicians/ Internal Medicine/ Endocrinology, Diabetes & Metabolism | 62,862 | 2.00% |
| Allopathic & Osteopathic Physicians/ Urology | 61,165 | 2.00% |
Top 10 Specialties by Total Amount Paid
Now that we’ve looked at how many payments were made, let’s see who is getting paid the most. I’d wager it’s not the same list.
#Which specialties are getting the most money?
top_total_by_specialty = sorted(totals_by_specialty\
                               , key=lambda t : t[2], reverse=True)[0:10]
total_amount_by_specialty = sum([t[2] for t in totals_by_specialty])
print_table(['Specialty', 'Amount of Payments', '% of Total Amount']\
           , [x[0] for x in top_total_by_specialty]\
           , [ ['$' + locale.format('%0.2f', x[2], grouping=True)\
               , '{0:.2f}%'.format(100*x[2]/total_amount_by_specialty)\
               ] \
               for x in top_total_by_specialty\
             ]\
)| Specialty | Amount of Payments | % of Total Amount |
|---|---|---|
| " | $209,192,160.39 | 31.24% |
| Allopathic & Osteopathic Physicians/ Orthopaedic Surgery | $80,157,503.04 | 11.97% |
| Allopathic & Osteopathic Physicians/ Internal Medicine | $26,616,544.66 | 3.98% |
| Allopathic & Osteopathic Physicians/ Internal Medicine/ Cardiovascular Disease | $24,291,090.52 | 3.63% |
| Allopathic & Osteopathic Physicians/ Psychiatry & Neurology/ Psychiatry | $18,724,216.32 | 2.80% |
| Other Service Providers/ Specialist | $17,475,702.37 | 2.61% |
| Allopathic & Osteopathic Physicians/ Psychiatry & Neurology/ Neurology | $16,974,664.19 | 2.54% |
| Allopathic & Osteopathic Physicians/ Neurological Surgery | $15,848,473.39 | 2.37% |
| Allopathic & Osteopathic Physicians/ Internal Medicine/ Endocrinology, Diabetes & Metabolism | $15,525,370.10 | 2.32% |
| Allopathic & Osteopathic Physicians/ Internal Medicine/ Gastroenterology | $14,570,253.86 | 2.18% |
While very many people without specialties listed are getting paid, those Orthopedic Surgeons are getting paid nearly $12\%$ of the total amount paid to everyone. General internal medicine is a distant second.
Top 10 Total Gift Payments by Physician and Payer
I’m intrigued by this gift category, so I wanted to figure out who is getting the most in gifts and by whom.
#who is getting the most gifts?
gift_amount_by_physician = sqlContext.sql("""select physician_id
                                                  , physician_specialty
                                                  , payer
                                                  , count(*) as cnt
                                                  , sum(amount) as total
                                             from payments
                                             where reason = \'Gift\'
                                             group by physician_id
                                                    , physician_specialty
                                                    , payer
                                             order by total desc
                                             """)\
                                     .filter(lambda t:len(t[0]) > 3)\
                                     .take(10)

print_table( ['Physician'\
             ,'Specialty'\
             , 'Payer'\
             , 'Number of Gifts'\
             , 'Total Amount for Gifts'\
             ]\
           , [x[0] for x in gift_amount_by_physician]\
           , [ [ x[1] \
               , x[2] \
               , locale.format('%d', x[3], grouping=True)\
               , '$' + locale.format('%0.2f', x[4], grouping=True)\
               ] \
             for x in gift_amount_by_physician]\
)| Physician | Specialty | Payer | Number of Gifts | Total Amount for Gifts |
|---|---|---|---|---|
| 225073 | Dental Providers/ Dentist/ General Practice | Dentalez Alabama, Inc. | 1 | $56,422.00 |
| 364744 | Other Service Providers/ Specialist | Ellman International | 1 | $37,699.00 |
| 446958 | Dental Providers/ Dentist/ Endodontics | Tulsa Dental Products LLC | 6 | $37,216.28 |
| 523360 | Dental Providers/ Dentist/ Prosthodontics | GAC International LLC | 14 | $23,562.07 |
| 244739 | Allopathic & Osteopathic Physicians/ Family Medicine | Mallinckrodt LLC | 1 | $19,488.75 |
| 92931 | Allopathic & Osteopathic Physicians/ Psychiatry & Neurology/ Neurology | Mallinckrodt LLC | 1 | $19,370.35 |
| 481461 | Dental Providers/ Dentist/ Orthodontics and Dentofacial Orthopedics | GAC International LLC | 1 | $18,573.00 |
| 9126 | Dental Providers/ Dentist/ Orthodontics and Dentofacial Orthopedics | GAC International LLC | 7 | $15,750.58 |
| 523314 | Dental Providers/ Dentist/ Orthodontics and Dentofacial Orthopedics | GAC International LLC | 1 | $15,000.00 |
| 224960 | Laboratories/ Clinical Medical Laboratory | Tosoh Bioscience, Inc. | 5 | $14,001.00 |
Dentists have obviously been good this year, because they feature prominently in the big gift receiver list. $56,422 in a single gift to a dentist from Dentalez, a dental chair manufacturer. That’s very generous. This may also be bad data. The Wallstreet journal found that at least some of these categories are misreported after someone racked up a $70k+ in food and beverage costs that should’ve been in consulting.
Top 10 Food and Beverage Payments to Physicians by Payers and Total Amount Paid
#who is getting the most Food?
food_amount_by_physician = sqlContext.sql("""select physician_id
                                                  , physician_specialty
                                                  , payer, count(*) as cnt
                                                  , sum(amount) as total
                                             from payments
                                             where reason = \'Food and Beverage\'
                                             group by physician_id
                                                    , physician_specialty
                                                    , payer
                                             order by total desc
                                             """)\
                                     .filter(lambda t:len(t[0]) > 3)\
                                     .take(10)

print_table( [ 'Physician','Specialty'\
             , 'Payer', 'Number of Payments'\
             , 'Total Amount for Payments'\
             ]\
           , [x[0] for x in food_amount_by_physician]\
           , [ [ x[1] \
               , x[2] \
               , locale.format('%d', x[3], grouping=True)\
               , '$' + locale.format('%0.2f', x[4], grouping=True)\
               ] \
             for x in food_amount_by_physician]\
)| Physician | Specialty | Payer | Number of Payments | Total Amount for Payments |
|---|---|---|---|---|
| 200720 | Allopathic & Osteopathic Physicians/ Surgery | Teleflex Medical Incorporated | 4 | $78,183.81 |
| 28946 | Dental Providers/ Dentist/ General Practice | BIOLASE, INC. | 6 | $29,608.22 |
| 405597 | Allopathic & Osteopathic Physicians/ Ophthalmology | Lundbeck LLC | 67 | $14,955.02 |
| 29943 | Allopathic & Osteopathic Physicians/ Urology | Auxilium Pharmaceuticals, Inc. | 62 | $13,138.35 |
| 245373 | Allopathic & Osteopathic Physicians/ Anesthesiology | Depomed, Inc. | 36 | $12,647.92 |
| 232708 | Allopathic & Osteopathic Physicians/ Neurological Surgery | Baxano Surgical, Inc. | 28 | $10,641.94 |
| 328465 | SonaCare Medical, LLC | 4 | $9,997.92 | |
| 440053 | Allopathic & Osteopathic Physicians/ Internal Medicine | Pfizer Inc. | 36 | $9,690.36 |
| 201967 | Allopathic & Osteopathic Physicians/ Surgery/ Surgical Oncology | Intuitive Surgical, Inc. | 18 | $8,601.26 |
| 154591 | Other Service Providers/ Specialist | Ranbaxy Inc. | 10 | $8,347.49 |
As I was saying earlier, that first entry is a miscategoried set of consulting fees as found by the WSJ. However, looking past that, nearly $30k to a dentist over 6 food and beverage reimbursements. I would definitely be looking closer if this was data that came to me as part of my day-job.
Top 10 Payers and Reasons by Total Amount Paid
#Who is paying the most and for what?
amount_by_payer = sqlContext.sql("""select payer
                                         , reason
                                         , count(*) as cnt
                                         , sum(amount) as total
                                    from payments
                                    group by payer, reason
                                    order by total desc
                                 """)\
                            .filter(lambda t:len(t[0]) > 3)\
                            .take(10)
print_table( ['Payer','Reason'\
             , 'Number of Payments'\
             , 'Total Amount for Payments'\
             ]\
           , [x[0] for x in amount_by_payer]\
           , [ [ x[1] \
               , locale.format('%d', x[2], grouping=True)\
               , '$' + locale.format('%0.2f', x[3], grouping=True)\
               ] \
             for x in amount_by_payer]\
)| Payer | Reason | Number of Payments | Total Amount for Payments |
|---|---|---|---|
| Genentech, Inc. | Royalty or License | 65 | $122,548,134.00 |
| DePuy Synthes Sales Inc. | Royalty or License | 247 | $27,730,373.58 |
| Arthrex, Inc. | Royalty or License | 259 | $11,524,088.26 |
| Biomet, Inc. | Royalty or License | 301 | $9,966,304.43 |
| AstraZeneca Pharmaceuticals LP | Compensation for services other than consulting, including serving as faculty or as a speaker at... | 5,237 | $9,529,667.44 |
| Zimmer Holding Inc | Royalty or License | 115 | $9,132,692.18 |
| Pfizer Inc. | Grant | 107 | $7,989,769.90 |
| Forest Laboratories, Inc. | Compensation for services other than consulting, including serving as faculty or as a speaker at... | 5,165 | $7,633,516.85 |
| Janssen Pharmaceuticals, Inc | Compensation for services other than consulting, including serving as faculty or as a speaker at... | 3,742 | $7,423,565.00 |
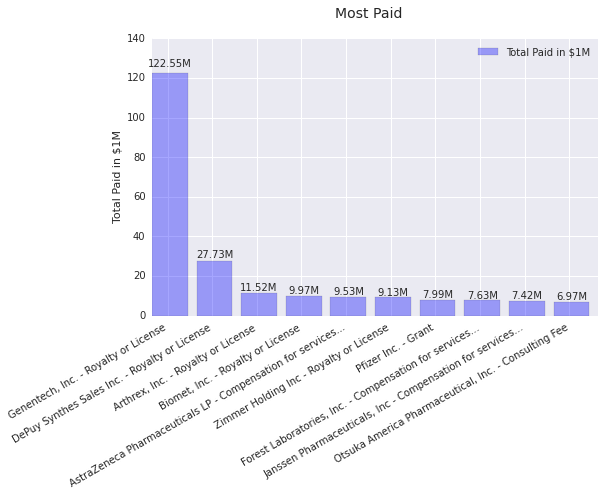
| Otsuka America Pharmaceutical, Inc. | Consulting Fee | 4,098 | $6,972,416.19 |
Turns out royalties and licensing fees are pretty expensive. Genentech spent more on 65 royalties/licensing payments in 2013 than the gross domestic product of Montserrat and Tuvalu. Considering, however, their revenue is in the orders of $10 Billion, that’s still only a tiny fraction. Even so, as you can see from the bar chart below, they dominate the rest of the payments across all reasons for any company by a fair margin.
#Take the data above and generate a bar chart with it
bar_chart([ [x[0] + ' - ' + truncate(x[1], length=20) \
            , x[3] /1000000.0 \
            ] for x in amount_by_payer ]\
         , 'Most Paid'\
         , 'Total Paid in $1M'\
         , 'Payer/Reason'\
         , False\
         )
Up Next
Next, we do some outlier analysis on the payment data. This is part of a broader series of posts about Data Science and Hadoop.
Casey Stella 24 October 2014 Cleveland, OH