A Blockchain Story Told Through The Eyes of Two Users
Blockchains are Big Data
I saw a commercial for Enterprise blockchains by Oracle during a football game this weekend. I’ll just pause to let that sink in. It is undeniable that this little (slightly) esoteric corner distributed computing is fully riding the hype train right now. It’s no doubt that the runup in price by the core cryptocurrencies combined with pointed skepticism from mainline economists and financial analysts are driving interest in the technology. It’s the perfect mixture of nerdiness, drama and money to pique the interests of even the most bloodless in the tech industry.
I’m a data scientist working in a very specific niche: dealing with “Big Data” (shout out to Apache Metron). When blockchains came to my notice the sheer transparency of them was exceptionally exciting and liberating. Traditionally things like currencies operate like a black box, where one looks at the inputs, the outputs and tries to develop sensible guesses as to what is going on inside the black box. With blockchains, due to the fact that they are essentially immutable ledgers of transactions, one can crack open the nut and get at the juicy transaction details kept inside.
Blockchains as they stand right now operate at relatively anemic transaction rates as compared to other financial transaction systems that one uses day-to-day (e.g. Visa). Also, they’ve been around for a somewhat limited amount of time. These two aspects together put into question whether this truly is a “big data” problem or just a regular data problem. I contend, and hopefully will show in a bit here, that nontrivial analysis of blockchains puts us in a “small-to-medium data, big compute” territory. As such, this fits well within my preferred data analysis tools of Apache Spark, Python and Jupyter.
Ethereum: A Virtual Machine on a Chain
The most attractive blockchain to analyze, in my opinion, is Ethereum. From Wikipedia:
Ethereum is an open-source, public, blockchain-based distributed computing platform featuring smart contract (scripting) functionality. Ether is a cryptocurrency whose blockchain is maintained by the Etherium platform, which provides a distributed ledger for transactions. Ether can be transferred between accounts and used to compensate participant nodes for computations performed. Ethereum provides a decentralized Turing-complete virtual machine, the Ethereum Virtual Machine (EVM), which can execute scripts using an international network of public nodes. “Gas”, an internal transaction pricing mechanism, is used to mitigate spam and allocate resources on the network.
I like several aspects of this project:
- It is well used every day and growing in popularity
- It seems to have a broad vision; the blockchain as a platform for smart contracts is enticing
- It’s moving away from a proof of work model, which results in huge energy consumption
- Gathering transaction data from geth, the ethereum node, is do-able via a JSON-RPC interface they provide.
The thing that I like the most, however, is that it seems to be a multi-use chain. You see a lot happening on this blockchain:
- Cat breeding games
- A proper cryptocurrency (named Ether)
- Other cryptocurrencies (e.g. ERC-20) and initial coin offerings
For these reasons, Ethereum seems like the blockchain most ripe for analysis. Specifically it would be interesting to find some analytics that might yield insights on how this chain works on a day-to-day basis. While not necessarily tied to predicting price, it would be of particular interest to investors to find something which connects, even indirectly, to future price.
The Tale of Two Users
It’s easy to say one should be looking at advanced analytics using the full data from the blockchain. It’s quite a different story to actually suggest what to look at here. I will proceed from a couple of observations:
- Transaction data forms a graph, so it is possible to borrow machinery from Graph Theory if necessary
- There are at least two interesting actors in this scenario: the new user and the established player
The “new user” is a user who is using the blockchain for the first time, whereas the “established player” is a hash which is important and somewhat central to the blockchain (e.g. involved in both sending and receiving transactions to many people). I maintain that these are two interesting actors insomuch as observing the blockchain transactions from the vantage point of these users will yield insights as to the general health, well-being and state of the blockchain. If either of these actors change their behavior appreciably, it’s worth knowing and will probably have some impact on the fundamental usage patterns of the blockchain in question. Maybe even, if we’re very lucky, give us a hint on how the price may change.
We now face a couple of challenges:
- Formally defining these two actors in such a way that one can distinguish between them could be computationally daunting
- What precisely should one measure through the lens of these actors?
Starting from the bottom, I think a sensible starting point here is to measure the daily percentage of transactions being done by each of these actors. Plotting this opposite the price, one may see the effect that each of these actors may have on the price.
The New User Impact
Let’s call the daily percentage of transactions involving a hash never before seen to be the “new user impact.” Just the act of picking out hashes that have never been seen before can be rather daunting given that there have been over 20 million distinct hashes between Ethereum’s inception and January 18, 2018. Doing this sort of analysis belies a simple SQL query but is well within Spark’s sweet spot of enabling more low level operations and distributed computing primitives. Judicious usage of bloom filters in Spark opens us up to performing these kinds of computations in a scalable way.
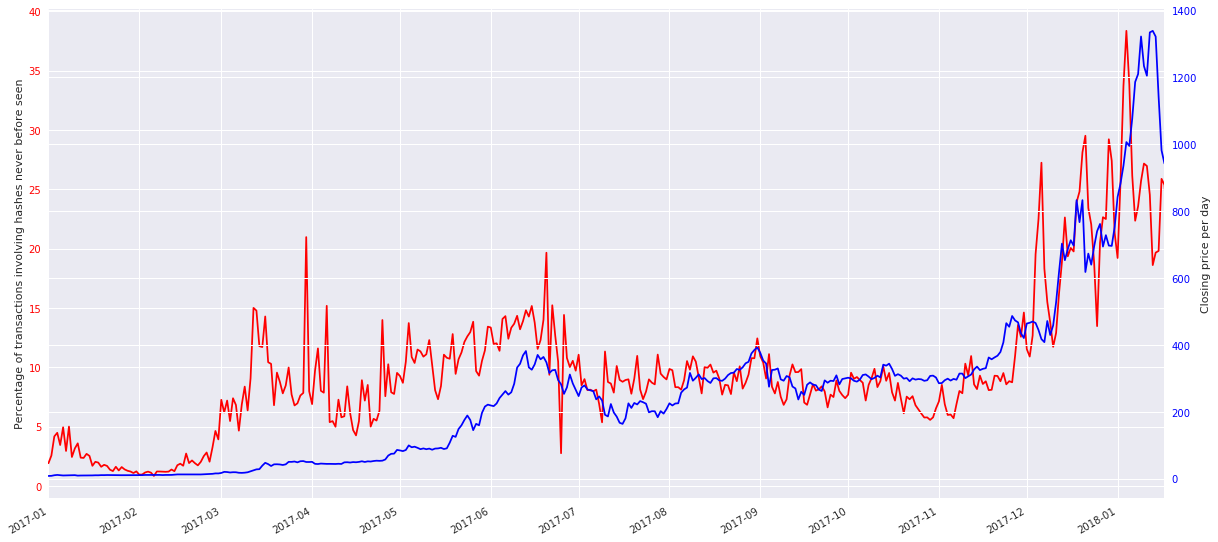
Observe the above plot from the timerange between January 1, 2017 until January 18, 2018 with the closing price per day in blue plotted opposite the percentage of the daily transactions involving a hash never before seen (the daily new user impact) in red.
Note the discordant nature of the new user impact and how little correlation to price is happening prior to mid-November. The behavior prior to mid-November is in stark contrast to the run-up in price and strong connection to the new user impact that happens from mid-November until early January. The fascinating thing here is that the new user impact seems to dip prior to the price dip in early January. It’s unclear whether this is a reliable early indicator (especially given its chaos earlier in the year), but it’s certainly worth investigating. It is somewhat unfortunate how volatile the new user impact becomes from mid-December onward.
The Established Player Impact
In contrast to the “new user” as an actor, whose definition is easy to pin down in a technical way, the established player is tougher to specify in a rigorous way. Given the fact that the transactions on a blockchain form a graph, one can borrow from graph analytics some tooling to help us out. Specifically, define an “established player” for a specific day to be a hash such that the undirected pagerank of the hash is in the top 10% of pageranks given the transaction graph of the previous 14 days. The intuition here is that this will define a set of “important” hashes in the network. Tracking how much of the network operates from these important hashes daily will give us some idea of the impact of the big players, such as exchanges and market makers, in the network.
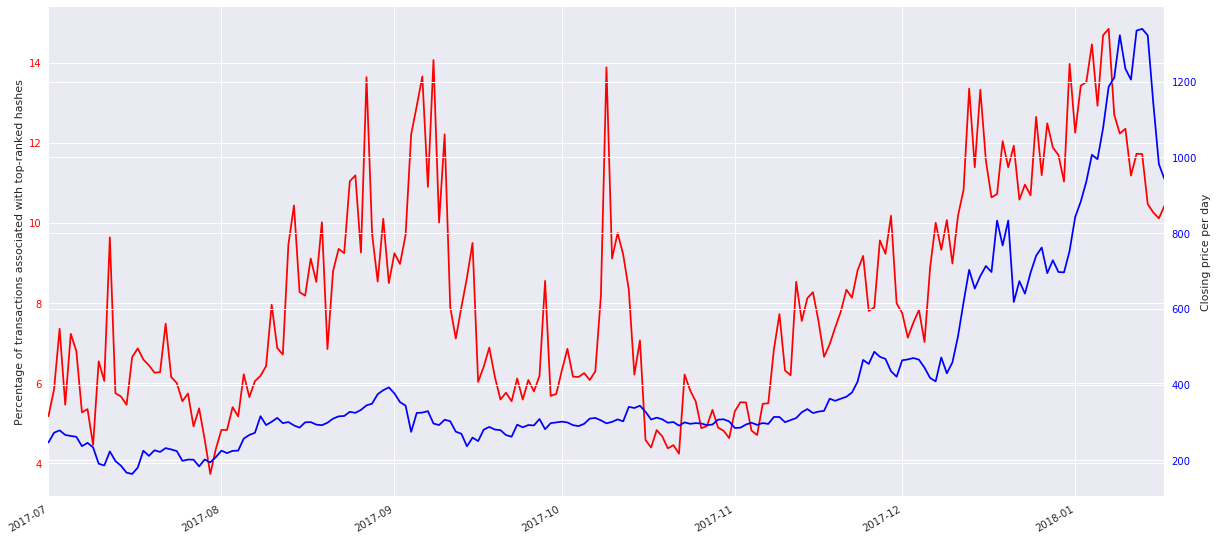
Observe the above plot from an abbreviated timerange of July 2017 until January 18, 2018 with the closing price per day in blue plotted opposite the percentage of the daily transactions involving a hash from an established player in red. Note that this timerange is abbreviated because it’s fairly costly to compute the pagerank of even 2 weeks worth of transaction data (note that a more serious analysis would imply more serious compute and thus might adjust these parameters).
The thing I immediately notice here is that, like the new user impact, the established player impact seems to couple with the price starting in mid-November. Also, similar to the new user impact, it deviates prior to the actual cost drop, but is decidedly less chaotic immediately prior to the mid-January dip and thus possibly more reliable.
In Conclusion
The core impulse behind this exercise is to find some essential analytics to summarize behavior of the network from a particular vantage point (or set of vantage points). One must be careful drawing conclusions of predictive leading indicators of price from this exercise. Rather, stepping back, there are the beginnings of a set of analytics that one can monitor over time to better understand how Ethereum, as a blockchain, moves, lives and breathes on a day-to-day basis. Inflection points in these analytics tie to usage shifts and assumptions in the technical analysis of this blockchain should be reevaluated or else risk becoming stale or less-effective. For instance, if one sees a precipitous drop in the new user impact over a week, then either users are not using the chain (which you can see in early 2017 in the “New User Impact” plot) or Ethereum has reached saturation (i.e. no new users, but still much usage). For a young blockchain, new user usage is imperative for robust growth and thus it’ll be a turning point when the chain is saturated.
Thinking beyond this analysis, I plan to go on and look at some of the other graph theoretic analytics that can be tracked over time in both Ethereum as well as other established blockchains, most obviously Bitcoin:
- The number of transaction triangles per day to get an indication of the transaction movement in the chain
- The number of “communities” in the transaction graph by applying a label propagation algorithm to the transaction graph daily.
Also, looking closer at analytics involving the amount of ethereum transacted per day:
- 50th, 75th, 90th and 95th percentile of the amount of ether transacted by new users
- 50th, 75th, 90th and 95th percentile of the amount of ether transacted by established players